Reading Mint Bullion Coin Sales: What the Numbers Really Show
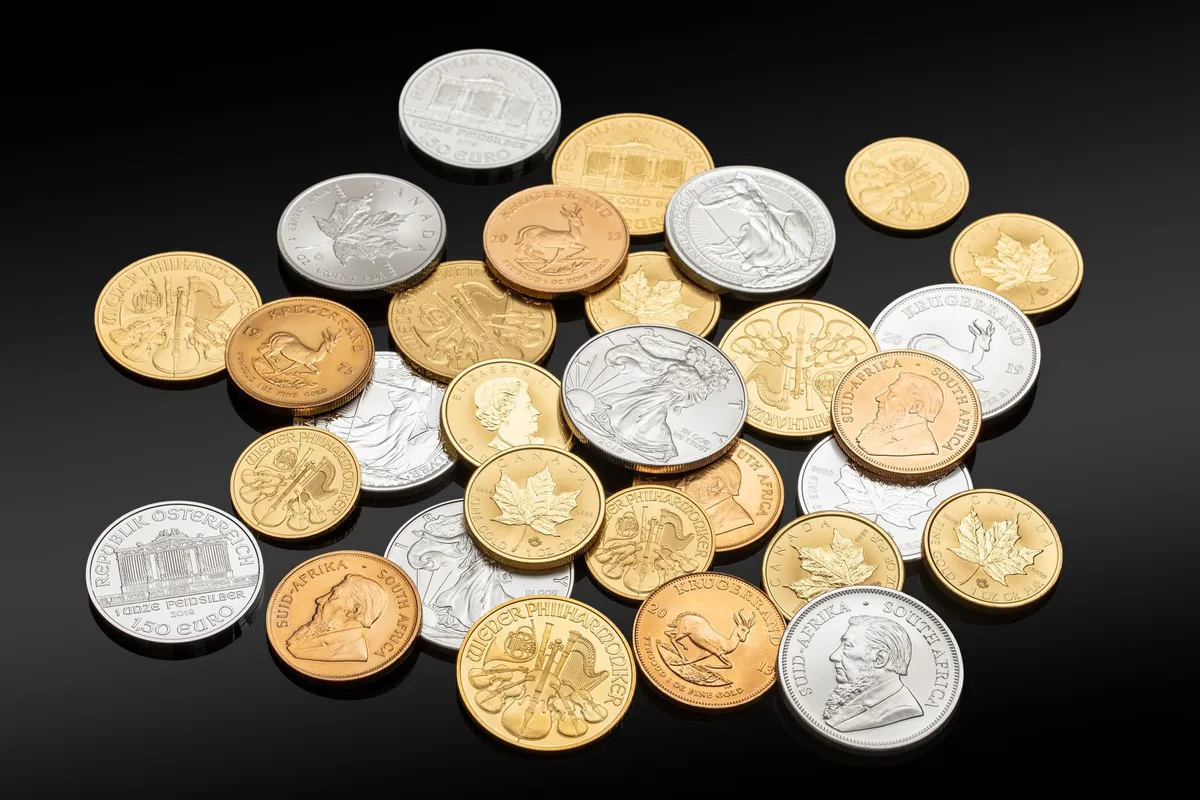
When markets are turbulent, headlines often report that a national mint has sold a record number of gold or silver coins. These figures are among the few public, regularly updated measures of retail interest in precious metals, so commentators lean on them heavily. They can be informative, but only if you understand what is actually being counted and what is left out.
What mint sales figures measure
The major sovereign mints that produce bullion coins, such as the United States Mint, the Royal Canadian Mint and the Perth Mint in Western Australia, generally do not sell bullion coins directly to the public in volume. Instead, they sell to a network of large wholesalers and dealers. In the US these are known as authorized purchasers, firms that meet financial and operational requirements and buy coins in bulk at a premium over the metal’s value.
Authorized purchasers then sell to smaller dealers and, through them, to retail customers. So the headline sales numbers show:
- coins shipped from the mint to the wholesale network, not coins bought by individuals;
- orders placed weeks earlier, sometimes reflecting inventory building rather than current demand;
- production capacity as much as appetite, because a mint cannot sell more than it can strike.
The Perth Mint and Royal Canadian Mint report through their own channels and on their own schedules, often in annual or periodic reports, so cross-mint comparisons are rough.
The American Eagle programs
The US Mint launched its American Eagle bullion coins in 1986. The Silver Eagle contains one troy ounce of .999 fine silver. The Gold Eagle is struck in 22-karat gold in several sizes, with the stated gold weight, such as one ounce, contained in a slightly heavier coin because of the alloy. The Mint later added the 24-karat American Buffalo gold coin and platinum and palladium Eagles.
The US Mint publishes running monthly and annual sales totals for its bullion coins, which is why American Eagle figures dominate commentary. Canada’s Maple Leaf series, launched in gold in 1979, and Perth’s Kangaroo and other bullion lines are equally important globally, but their data is less granular or less timely.
Why sales spike in crises
Bullion coin sales tend to surge when confidence falls:
| Trigger | Typical retail reaction |
|---|---|
| Banking or financial crisis | Buying of coins as assets outside the financial system |
| Sharp price drop | Bargain hunting by existing holders |
| Inflation or currency worries | Hedging and long-term saving in metal |
| Political or pandemic shocks | Precautionary buying, sometimes panic |
The second row is often overlooked. Coin buying frequently jumps after prices fall, not only when they rise. In 2013, a steep decline in futures prices was followed by heavy demand for coins and small bars. That is one reason mint data and price can move in opposite directions.
Premiums and rationing
When demand outruns supply, the first sign is usually the premium, the amount over spot that buyers pay for a coin. Premiums widen at every link in the chain: the mint’s wholesale premium, the authorized purchaser’s markup and the retail price. For silver coins in particular, retail premiums can climb to a large multiple of their normal level during shortages.
Mints have repeatedly responded by allocating or rationing coins, limiting how many each authorized purchaser can order each week. The US Mint did this for Silver Eagles around 2008 and in several later episodes, including during the pandemic, when production constraints and a shortage of blanks compounded a surge in orders. Sales figures during rationing reflect the cap, not the true demand, which can make a record month look calm or a rationed month look weak.
The relationship between paper prices and these physical premiums is examined in our guide to COMEX and paper versus physical markets.
Limits of the data as a sentiment gauge
Mint sales are sometimes presented as a pure measure of investor mood. Several factors argue for caution:
- Wholesale timing. Dealers may front-load orders before an expected price rise or to restock after a sell-out.
- Capacity and blanks. A mint’s output depends on available planchets and minting lines.
- Product mix. Buyers shift between coins, bars, rounds and private-mint products depending on premiums. Low mint sales may mean buyers moved to cheaper bars.
- Secondary market. Existing coins resold to dealers satisfy demand without showing up in new mint sales. Strong selling back by the public can also overwhelm new purchases.
- Annual effects. New-year coins often see heavy January orders, and redesigns can distort comparisons.
- Small scale. Even record retail coin sales are modest compared with central bank buying, ETF flows or Asian physical demand.
Taken together, mint numbers tell you something about retail interest in a particular product in a particular market, mostly the United States. They do not measure global investment demand.
How to use the figures sensibly
Treat mint data as one piece of evidence. Compare it with the same month in previous years, check whether rationing was in place, and look at premiums, which often reveal more about physical tightness than unit counts. Broader context is available in our guides to gold versus silver and to Asian demand, which dwarfs Western coin buying in tonnage.
Key points
- Mint sales record shipments to authorized purchasers and wholesalers, not retail purchases.
- American Eagle bullion coins date from 1986 and dominate public data because of regular reporting.
- Sales often spike after price drops and during crises, along with premiums.
- Rationing caps reported figures, so sales may understate demand in tight periods.
- Mint data is a narrow, mostly US gauge of sentiment and should be read with premiums and other indicators.
This article may contain partner links. They never influence what we write.