The Gold-Silver Ratio: Definition, History and Limits
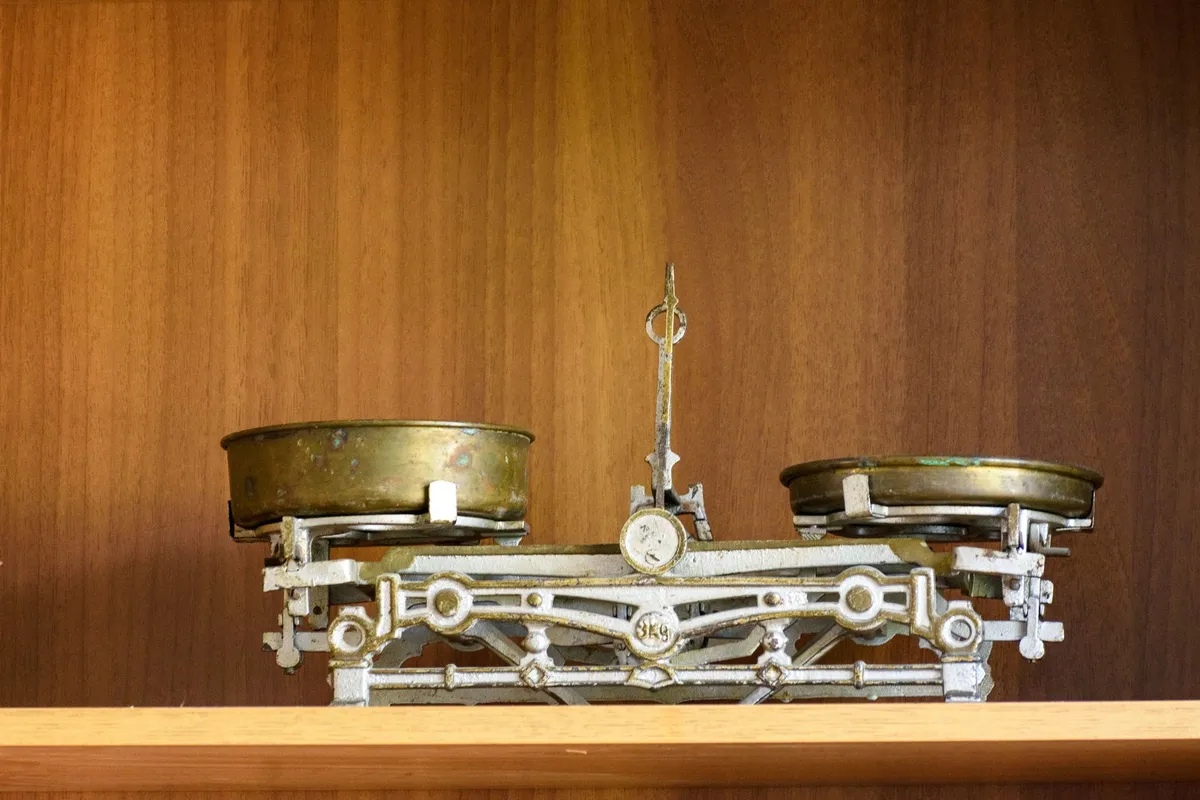
The gold-silver ratio is one of the oldest numbers in the precious metals world. It tells you how many ounces of silver it takes to buy one ounce of gold. For centuries governments fixed it by law; today it floats freely and swings across a wide range. Many collectors and traders keep an eye on it, but it is easy to read too much into it.
Definition and calculation
The ratio is simply the price of gold divided by the price of silver, both in the same currency and the same unit of weight:
Gold-silver ratio = gold price per troy ounce ÷ silver price per troy ounce
If gold trades at 80 times the price of silver, the ratio is 80, meaning one ounce of gold buys 80 ounces of silver. Because the currency cancels out, the ratio is the same whether you use dollars, euros or yen, as long as both prices are in the same currency and taken at the same moment.
A few practical points:
- Use spot prices, not retail coin prices, which include premiums that differ between the two metals.
- Use prices taken at the same time; mixing a morning gold quote with an afternoon silver quote can distort the result.
- Many charting services publish the ratio directly, which saves the arithmetic.
The bimetallic era
Before the 20th century, many countries ran bimetallic monetary systems in which both gold and silver coins were legal tender at a fixed legal ratio.
| Period | Legal ratio | Context |
|---|---|---|
| 1792 | 15:1 | US Coinage Act of 1792 |
| 1803 | 15.5:1 | French monetary law of the Year XI (Germinal) |
| 1834 | About 16:1 | US Coinage Act of 1834 |
These legal ratios created a recurring problem. Whenever the market ratio drifted away from the official one, the metal that was undervalued at the mint tended to disappear from circulation, exported or melted, while the overvalued one stayed in use. That is Gresham’s law at work. The US adjustment of 1834, for instance, made gold relatively more attractive to bring to the mint and left silver coins undervalued.
In the late 19th century, most major economies moved to the gold standard, large new silver discoveries came onto the market, and silver lost its monetary role. The “16 to 1” slogan of the US free silver movement in the 1890s referred to restoring that old legal ratio.
The modern floating ratio
Once silver was demonetized and gold later floated freely after the end of dollar convertibility in 1971, the ratio became a pure market number. It has ranged widely since then.
- Around the January 1980 peak, when silver briefly reached about $50, the ratio fell below 20.
- When silver again neared $50 in April 2011, the ratio dropped into the low 30s.
- In March 2020, during the market turmoil at the start of the pandemic, it rose above 100, an extreme by modern standards.
Between such episodes it has spent long stretches in a broad middle range, often somewhere between the 40s and the 80s. Any single “normal” figure depends heavily on the period chosen.
How traders use it
The ratio is mainly used as a relative-value gauge between the two metals:
- Switching between metals. Some holders swap gold for silver when the ratio is historically high (silver looks cheap relative to gold), and silver back into gold when it is low. The goal is to grow ounces over time rather than to forecast dollar prices.
- Timing new purchases. Someone already set on buying precious metals may lean toward whichever metal looks cheaper relative to the other.
- Pair trades. Futures traders can go long one metal and short the other to bet on the ratio itself, independent of the overall direction of prices.
- Reading market mood. A rising ratio often accompanies risk aversion and economic worry, since silver’s industrial side suffers more. A falling ratio often accompanies strong rallies in which silver outpaces gold. See what moves silver prices for why.
Limits of the ratio
The ratio is a description, not a forecast. Several limits are worth keeping in mind:
- No fixed anchor. The legal ratios of the 19th century were policy choices, and geology does not set a “natural” ratio either. There is no level to which it must return.
- Long stretches at extremes. The ratio can stay high or low for years. Switching too early can mean waiting a long time.
- Costs eat the edge. Each swap between physical metals involves selling at a dealer’s bid and buying at the ask, plus premiums that are usually higher on silver. Small swings in the ratio may not cover those costs.
- Different fundamentals. Gold and silver have different demand profiles, so their relationship can change structurally, for example as industrial uses grow.
Key points
- The ratio equals the gold price divided by the silver price.
- Legal ratios of about 15:1 to 16:1 applied in the 19th century.
- The modern ratio has swung from below 20 to above 100.
- It is a useful relative-value gauge but not predictive on its own.
- For background on each metal, see gold vs silver.
This article may contain partner links. They never influence what we write.